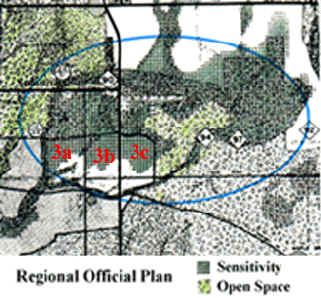
REGIONAL SENSITIVITY MAP
(Durham Region Official Plan)
Development was approved in 1970 not knowing the sensitivity of
this area. Amendment 12, 1980, pg. 12 states: "Population guidelines are based on
the potential development without review of environmental sensitivity; upon completion of
studies, it may be necessary to adjust the population guidelines to reflect the
sensitivity of any given area."
As you can see on the above map, the result of the 1981 E.I.A.
identified most of the area as being environmentally sensitive and open space. there was
even an agreement made with the Town, CLOCA and Region stating that: ... "the
lands identified in this study as ESA/Hazard and Open Space will be non-developable" (Commissioner's
Report #81-197, 1981.
From the 1981 Gartner Lee Study, the suggested population limits
were: 2300 in 3a, 2100 in 3b, and 1900 in 3c. In reality, the population was increased by
more than 50%: in 3a approx. 4100, 3b approx. 3100, and 3c approx. 2800 (the developer's
wish is 4400 despite the sensitivity). WILL the additional forest be removed for
development? (see location of 3a, 3b, 3c in Courtice)
In our opinion, all the consulting companies studies for
developers only indicate local changes in streams' water flow, and yet it is incredible
that after building a dozen subdivisions we still do not have data which is easy to
obtain. The flow of Farewell/Black Creeks, who's volume can be measured very easily at the
point of development entry, and exit before and after development. While we are dealing
with many studies and theories, this would be the best and most reliable approach. Why has
no one ever conducted this simple measurement? The answer is simple:
It is easier to confuse the public with theories than to
actually show them what the real impact of each and of all development, and it's
cumulative effect on our cold stream creeks and their water quality/quantity actually is.
The outflow from stormwater ponds or outfalls should be
measured, including unregulated outfalls.
Back to Map Links


[Home] [Site Map] [Who We Are] [Black-Farewell] [Black Creek 2001] [Local Wetlands] [What is a Wetland] [Our Watershed] [Map Links] [Current Events] [Studies] [MOEE Tips] [Photo Gallery] [Lake Iroquois] [Responsibility] [Govt. Contacts] [Enviro Links] [Message Forum]